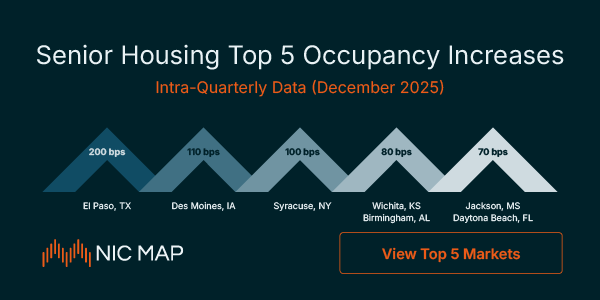
Latest Release: December 2025 Intra-Quarterly Data
The latest Intra-Quarterly Data for December 2025 is now available in the NIC MAP platform.
Key Market Changes:
- Seniors Housing Increased by 10 basis points
- Majority IL Increased by 10 basis points
- Majority AL Decreased by 0 basis points
- Majority NC Decreased by 0 basis points

Fill out the form to connect with a product expert.
What’s Included?
Each month, NIC MAP provides updated insights that help you act in-step with the market.
-
Stabilized occupancy, all occupancy, and inventory information
-
Three-month rolling data reported monthly
-
More than five years of time-series data
Shifts in occupancy, inventory, and development can impact investment and operational decisions. NIC MAP’s Intra-Quarterly Data is the only senior housing data source providing monthly market movement updates across 15,000+ properties.
With monthly updates, you can:
- See which markets are gaining or losing momentum sooner to adjust acquisition and portfolio strategies.
- Track supply changes sooner, ensuring development decisions align with actual market conditions.
