NIC MAP Vision: Household Dynamics Data
With data sourced from Experian, NIC MAP Vision now provides new population data — Household Dynamics — tailored to the senior housing industry. Stakeholders can now analyze migration patterns, living alone rates, cohabitation rates, and more for hundreds of millions of households and individuals across the U.S.
These new metrics provide increased granularity into the demographics and psychographic data at the person level of a household.
This new and powerful data set is accessible to users with an active Resident Insight subscription.
You can find the new data in “Site Detail Report” and “Explorer” in the NIC MAP Vision portal (currently Vision portal).
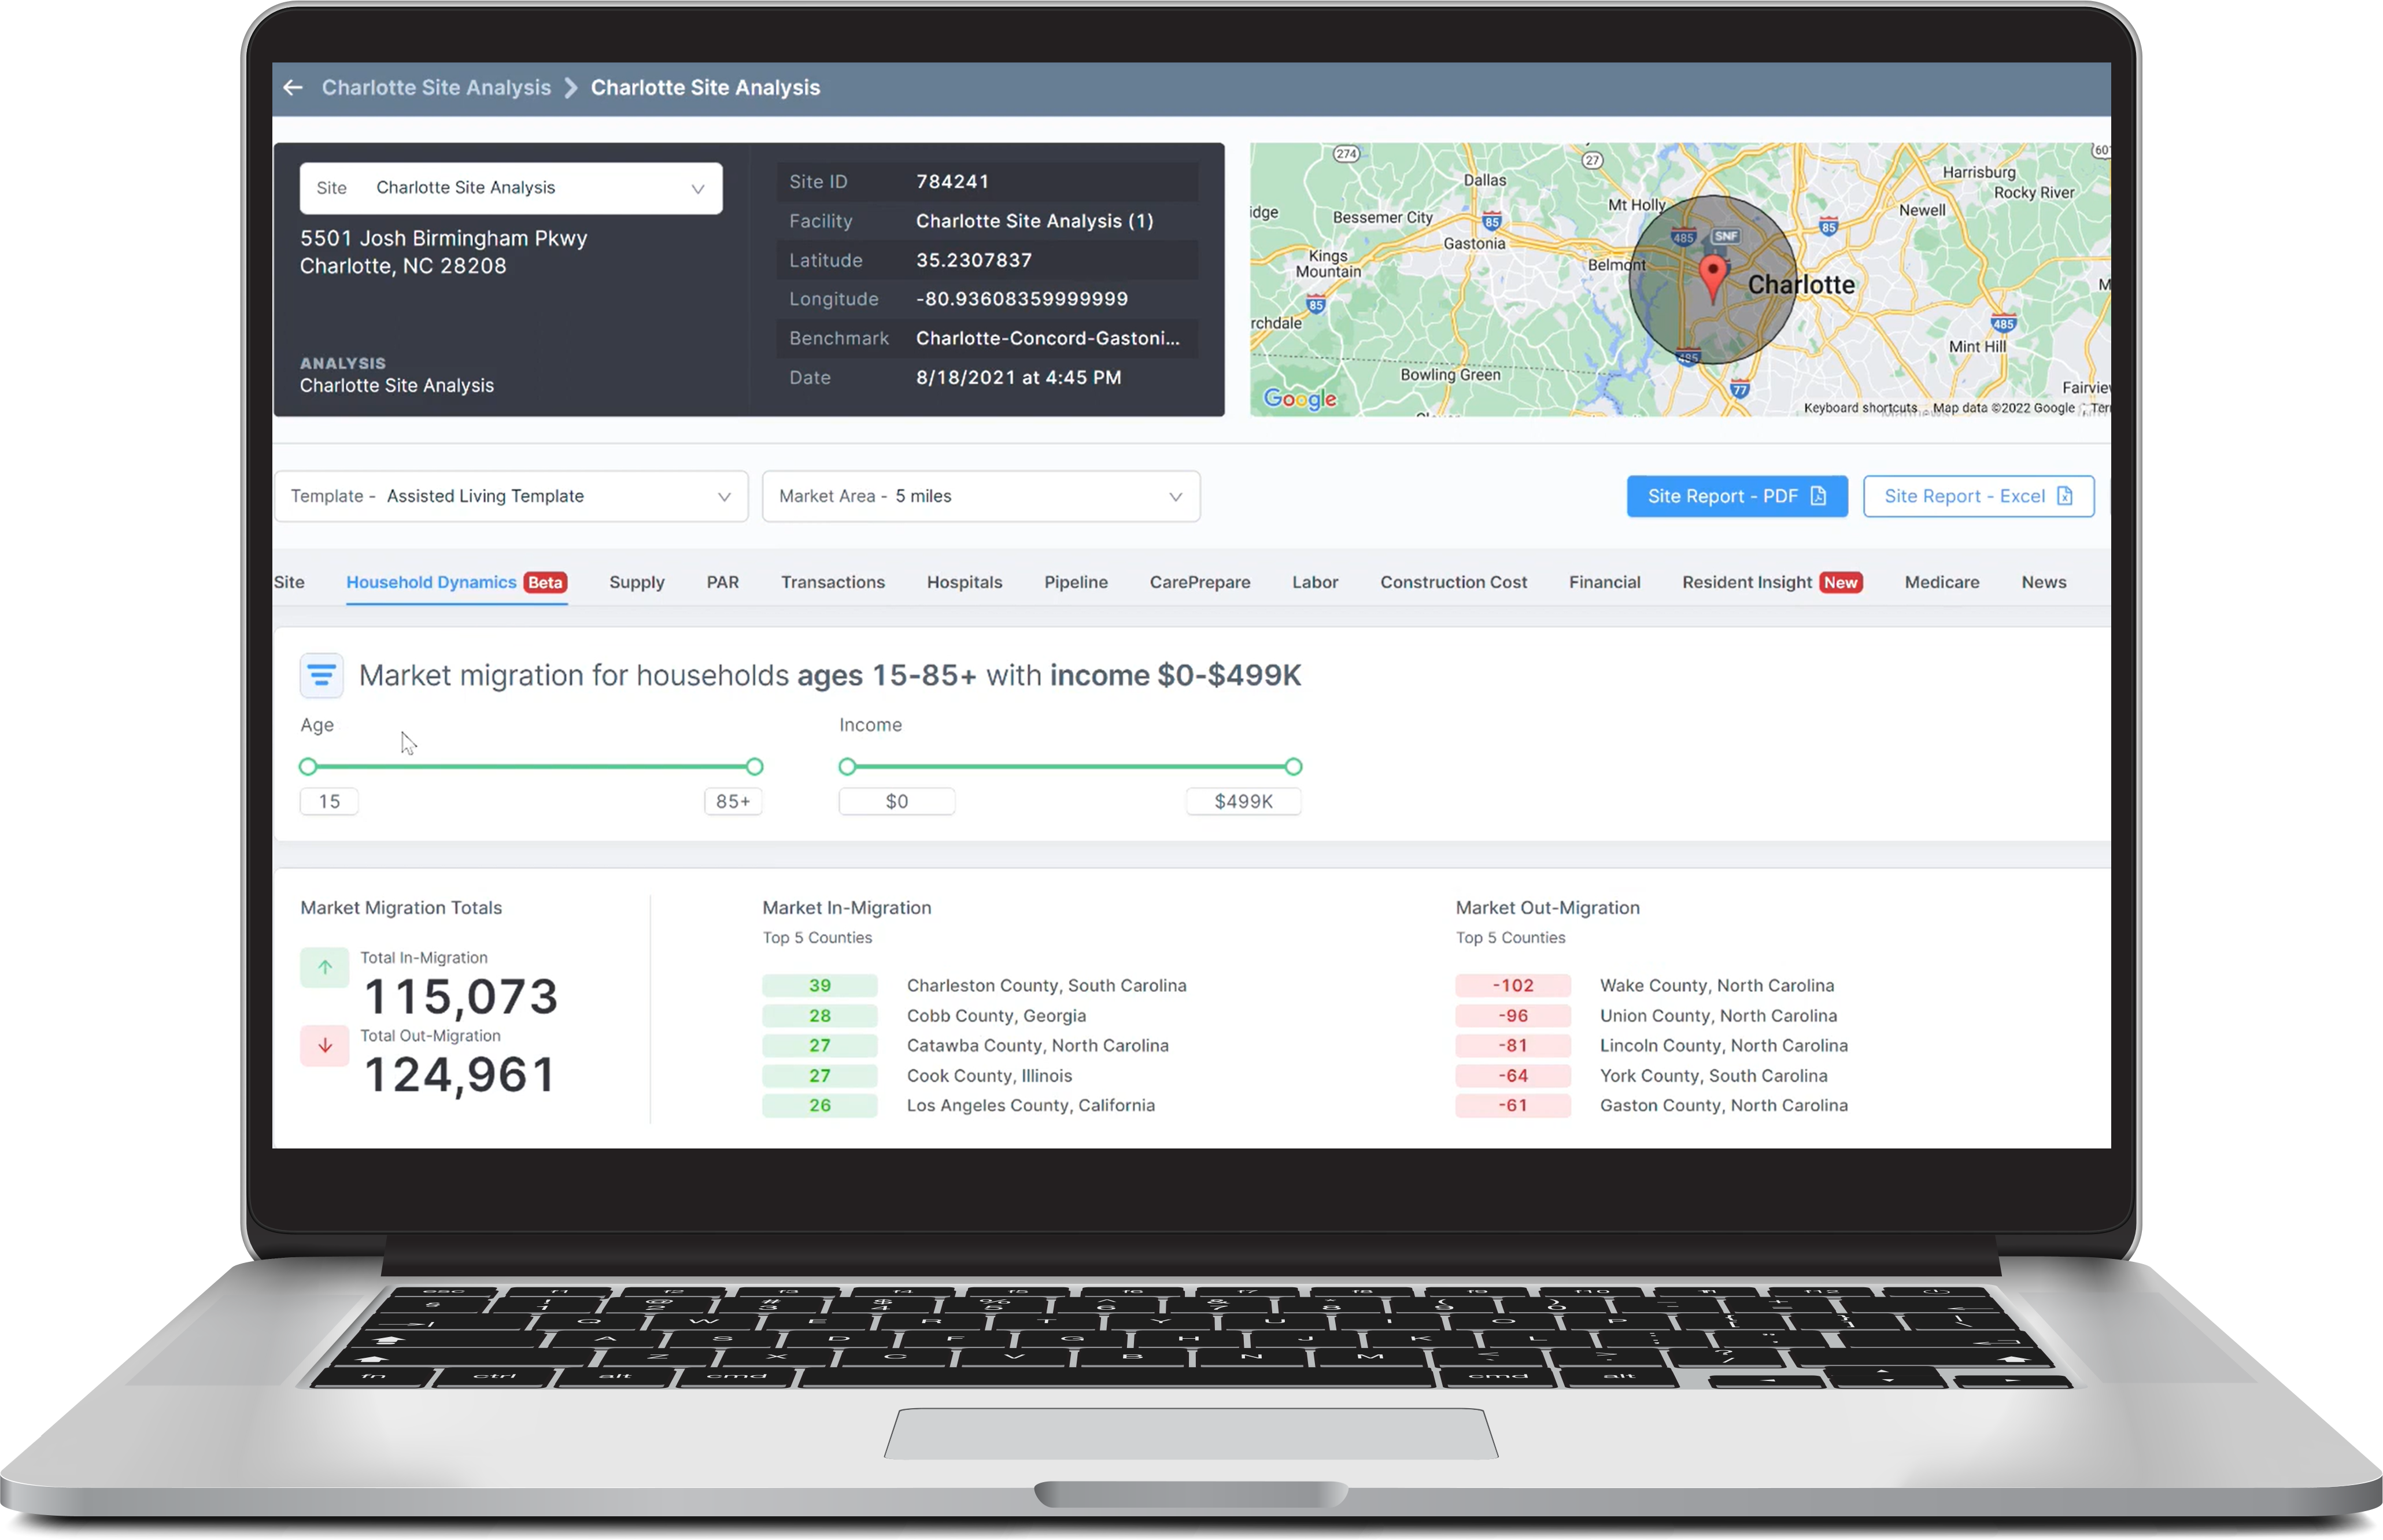
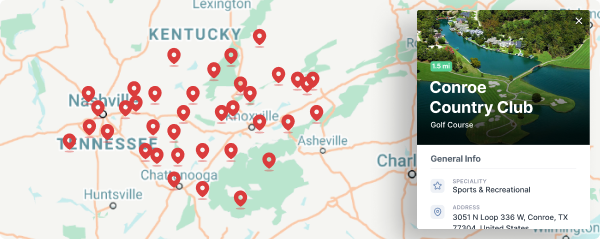
Interactive graphic display of migration patterns
An updated graphic display shows – in easy-to-digest detail – the in- and out-migration patterns of people from market to market.


Data Included?
- Sales Transactions
- Hospital Locations
- Existing Stock
- Construction Pipeline
- Occupancy & Rate Comps
- Demographics
- Property Characteristics
- and more!
How Often is the Data Updated?
Broken down by property type, care segments, and unit type, NIC MAP Vision is updated quarterly, monthly, and weekly varying by data set.
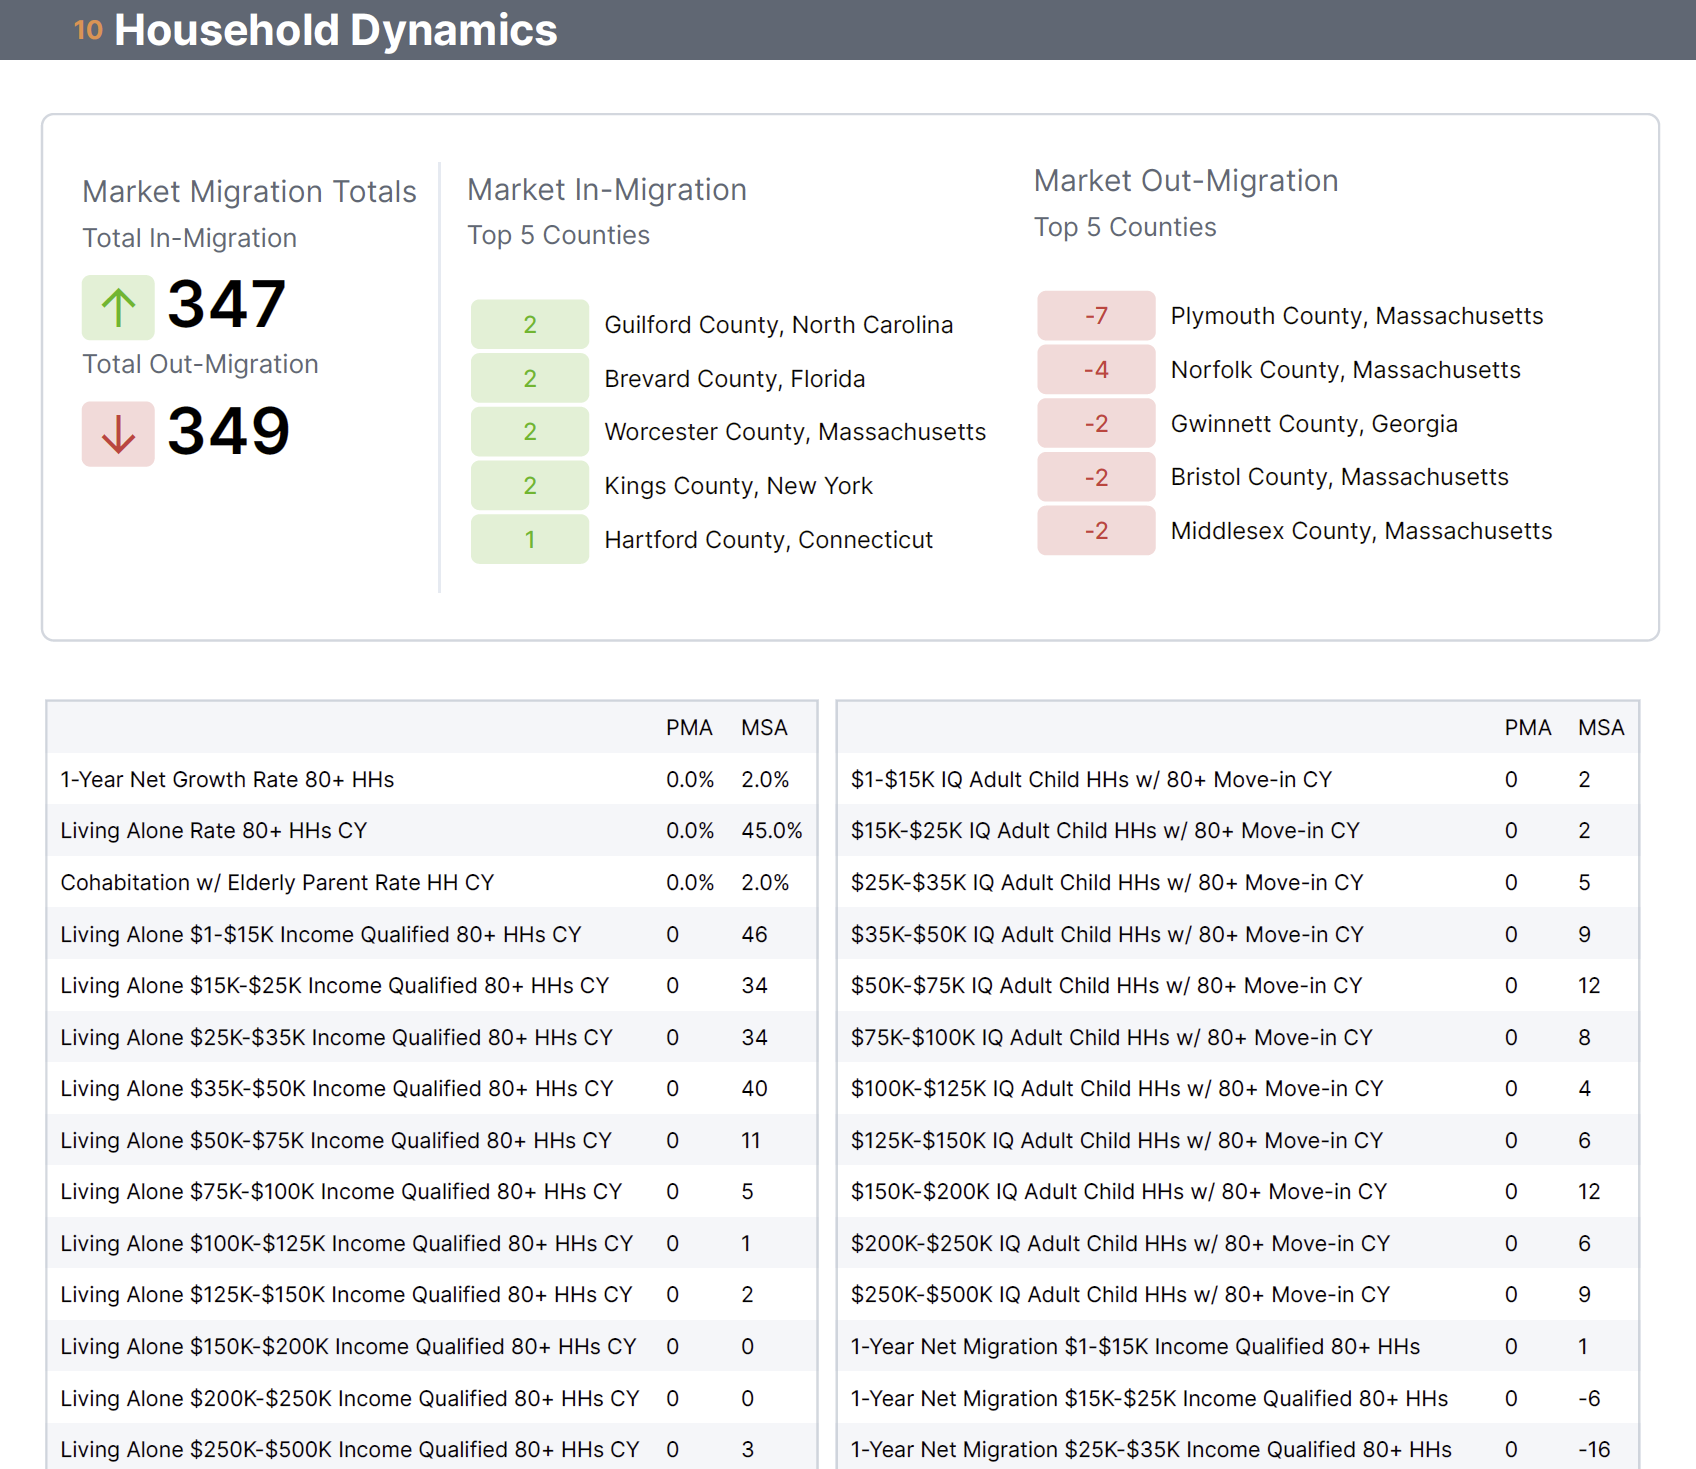
What's New?
- Identify markets where large percentages of adult children have an elderly parent cohabitating with them
- Gain information on household occupancy mix by age and income, including living alone percentages and cohabitation rates
- Analyze migration patterns for millions of households by age and income over the past 12 months
- Uncover which markets are benefiting from in-migration and which are suffering from out-migration
Use a Trusted Service
Feel confident knowing you use data from senior housing’s first model of unbiased, dependable data, trusted by the industry for more than 15 years.
Gain Actionable Data
Make informed decisions by having the market intelligence you need.
Save Time
Run complex analyses in minutes, including the ability to analyze thousands of markets at scale.
"NIC MAP Vision is indispensable and important to our business because it gives us the first look into a market that we otherwise have very limited information on. It also gives us information that is specific to our interests in the seniors housing industry, and in a demographic we look to target."
- Axel Guerra, Director of Acquisitions & Development at Kisco Senior Living
"NIC MAP Vision is really indispensable for us because it allows us speed and efficiency, whereas there wasn't a product that allowed us to do that previously."
- Ryan Chase, Partner and Executive Managing Director at Blueprint
"I would tell anyone who's interested in investing in NIC MAP Vision, that it is a great investment if they seriously want to be a player in the senior housing industry."
- Anne Hampton, Managing Director with Wells Fargo
"We see the actual rates program as our top strategic priority. It is truly foundational to the the data that is the lifeblood of the senior housing industry."
- Arick Morton, CEO at NIC MAP Vision
"It's indispensable because it's continuously updated and expanded, and the quality of the data collection and verification for a published database is extremely good."
- Alice Katz, President, The Vinca Group
"NIC MAP has become the standard for the industry."
- Colleen Blumenthal, Managing Partner, Health Trust
"The biggest assets that it brings to us includes the inventory of independent living buildings, the list of licensed communities in a market, and the communities that are under development."
- Alice Katz, President, The Vinca Group
"It's depth. It's scope. It's all the markets in the United States that we're interested in. So no other data service provides the level of information that NIC Data Service provides."
- Justin Dickinson, Senior VP, CA Senior Living
Interested in Learning More?
If you’re interested in learning more about this new data set, the capabilities of Resident Insight, or how to start using Household Dynamics data, schedule a meeting with a NIC MAP Vision product expert at a time that works for you.
*Existing and new clients with access to Market Insight are eligible for complimentary access to the newly updated Resident Insight tool from June 1 through August 31, 2022 as part of our ongoing beta.
Interactive graphic display of migration patterns
An updated graphic display shows – in easy-to-digest detail – the in- and out-migration patterns of people from market to market.
Beyond allowing access to Household Dynamics data, how else can I use Resident Insight?
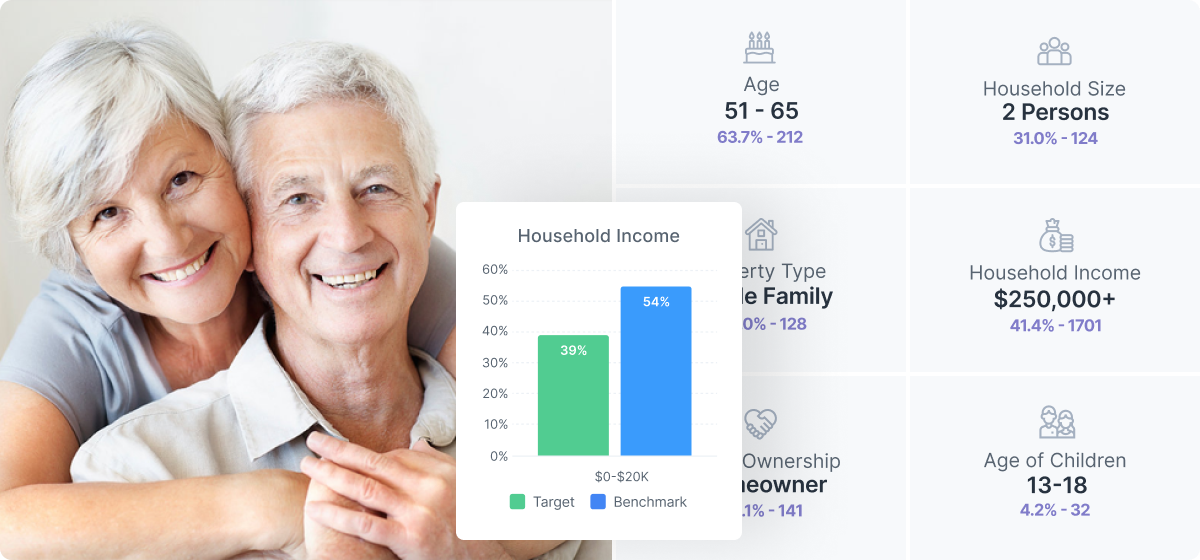
In addition to unlocking the new Household Dynamics data for users, Resident Insight provides wealth, income, and lifestyle preferences of senior housing residents.
As a quick overview, with Resident Insight you can:
Detailed Experian Mosaics give users the information necessary to better evaluate new areas of investment, tailor experiences aligned with resident preferences, and create more impactful messaging to prospective residents.
As a quick overview, with Resident Insight you can:
- Create rich lifestyle profiles of current residents and next-of-kin using Experian’s Mosaics
- Gain a deeper understanding of resident lifestyle preferences, spending habits, education history, and more
- Follow the wealth trends of residents and next-of-kin to evaluate building health and competitive positioning
- Attain insight into resident income, net worth, financial assets, and other wealth metrics.
Detailed Experian Mosaics give users the information necessary to better evaluate new areas of investment, tailor experiences aligned with resident preferences, and create more impactful messaging to prospective residents.